Friday, December 30, 2005

More on trending.

1. When $compx:tlt > 7d average and 28d average (uptrend):
108 days with a) cumulative return of 29.8%, and b) t+1 cumulative returns of 6.4%. t+1: 62 up days, 46 down days. average t+1 up day: 0.58%, average t+1 down day -0.64%

2. When $compx:tlt < 7d average and 28d average (downtrend):
102 days with a) cumulative return of -21.3%, and b) t+1 cumulative returns of -0.7%. t+1: 56 up days, 46 down days. average t+1 up day: 0.6%, average t+1 down day -0.76%.

3. When $compx:tlt = neutral: 42 days with a) cumulative return of -1.9%, and b) t+1 cumulative returns of -3.0%. t+1: 19 up days, 22 down days. average t+1 up day: 0.5%, average t+1 down day -0.54%.

Simple timing methods, part 2.

In 2005:
1. When $compx > 20d vwap & $compx > 40d vwap = 101 days. Cumulative return: 27%. average daily point gain: 5, st. dev: 13.3. 71 up days, 30 down days. average up day gain: 11.67, average down day gain: -10.6.

2. When $compx < 20d vwap & $compx < 40d vwap = 105 days. Cumulative return: -24%. average daily point gain: -5.5, st. dev: 17.5. 65 down days, 40 up days. average up day gain: 12, average down day gain: -16.

3. All other days (neutral days) = 46 days. Cumulative return: 5%. average daily point gain: 2.2, st. dev: 15.9, 25 up days, 21 down days. average up day gain: 14, average down day gain: -12.

Summary: stay with the trend.

good news, bad news

Good news: the recent selling in the indexes have been with very low volume, which supports the thesis that the selling was driven by futures selling. The indexes also have fallen below 2 standard deviations of price, which generally indicates a near-term bottom (see: James Altucher's How to Trade Like a Hedge Fund.) Additionally, a December-early January washout could setup a rally.

Bad News: Breaks below November-December lows.

Bullish outcome: Recent decline is an island reversal and market reverses.
Bearish outcome: Q4 2005 rally is over, potential test of prior lows.

Short 2005's winners on strength, ie NTRI short @ 37, HANS @ 82.

Simple timing system

From 1/3/05 to 12/29/05:
251 trading days: 115 down, 136 up. average down day: -0.68%, average up day: 0.59%. cumulative period return 1.9%. 43 points gained.

133 days when compq:tlt > 20d average, 48 down, 85 up. average down day: -0.51%, average up day: 0.58%. cumulative period return 28.4%. 526 points gained.

118 days when compq:tlt < 20d average, 67 down, 51 up. average down day: -0.79%, average up day: 0.59%. cumulative period return -21%. 483 points lost.

Thursday, December 29, 2005

12-30-05 Market Briefing

Friday, December 30, 2005

Market Strength 20-day high: ~2530 (12/05 monday)
Market Strength 20-day low: ~2406 (12/27 monday)

Market Strength 11-day stochastic: 1, imminent one-month breakdown

Nasdaq 20-day high: ~2270 (12/6)
Nasdaq 20-day low: ~2215 (12/20)
Nasdaq 11-day stochastic: 8, falling, imminent one-month breakdown

Breakout Strength, 11-day, 80-period %D stochastic: 32, neutral

Outlook: Watch for weekly breakdown. Assume defensive posture. Volatile moves, SPX:TLT ratio showing signs of breakdown, break of Wednesday's low may confirm downtrend. Sell into stength, tighten stops. Wary of false breakouts.

Find potential long and/or short plays for the first week of January. XAU shows best relative strength.

More questions than answers...

Does the chart below suggest that investors should swap one commodity for the other?


Does the chart below show that the consumer is finally tapped out?

The long-term.


As mentioned before, one chart that causes concern is the SPX:gold ratio. An increasing ration means paper assets (SPX) are in favor. The above chart shows the historical, 50-year ratio between SPX:gold. Note how historically, SPX has been much, much cheaper than gold (black line: SPX:gold, pink line: 10-year average). The above chart does not imply that the SPX:gold ratio will fall to its 1970s lows, but be aware that no matter how cheap the SPX seems today, it's not as cheap as it was in 1980.

A bad chart for bulls...


As stated by others, forecasting is folly. So take this with a grain of salt, but keep it at the back of your mind. The above chart's cup and handle indicates that while gold's current strength may only be the beginning of the trend. Over the past 25 years, gold has traded at levels higher than today. Assuming that gold returns to its early-1990s level of 0.75 to the SPX, gold should be @~$900, assuming SPX stays around 1250.

Naturally, this chart conflicts this other charts previously mentioned. What's the right answer? I don't know and won't know for a while. However be warned; the above chart indicates that the froth of the 1993-2000 bull run still remains.

Wednesday, December 28, 2005

Bull v. Bear

Bottom line: Obvious, but COMPQ/SPX need to break through 52-week highs (from November) on a convincing basis. A break below 2200 COMPQ/1250 SPX would be very bad. Ideal outcome: rotation away from emerging markets/commodities into US equities, which would be evidenced by the break of the downtrend below.


Bearish:


Each successive rally was been weaker than the prior.


SPX:TLT ratio dropping, but barely above prior range. Bullish if bottom holds.


SPX underperforming GLD, but bullish if bottom holds through January/2006.


$XAU outperforming SPX, not good.


Interesting forecast from UCLA professor re. unwinding of bubbles:

**********************************************************
Bullish:


Potential outperforming emerging from SOX.


Internet outperforming SPX.

January is the best month of the year for stock performance, per Robert Haugen and Josef Lakonishok explained in The Incredible January Effect: The Stock Market's Unsolved Mystery.


12-29-05 market briefing

Thursday, December 29, 2005

Market Strength 20-day high: ~2530 (12/05 monday)
Market Strength 20-day low: ~2406 (12/27 monday)

Market Strength 11-day stochastic: 14, neutral

Nasdaq 20-day high: ~2270 (12/6)
Nasdaq 20-day low: ~2215 (12/20)
Nasdaq 20-day stochastic: 26, falling

Breakout Strength, 20-day, 80-period %D stochastic: 35, rising

Outlook: Watch for weekly breakdown. Volatile moves, SPX:TLT ratio showing signs of stabilizing, but break of Wednesday's low may confirm downtrend. Sell into stength, tighten stops. Wary of false breakouts. Energy breaking down.

Find potential long and/or short plays for the first week of January.

Seeking balance in the yield curve.


The TLT (the long-end of the yield curve) has outperformed the middle of the curve for several years. The above chart is a visual representation of the yield curve conundrum and yield curve inversion, despite higher short-term rates. Should the "conundrum" unwind itself, watch as the uptrend/consolidation breaks down. If the TLT uptrend resumes, I don't know what's next...deflation?

US v. the World


The SPX is right at its October 2005 lows v. the MSCI world index. This is both troubling and hopeful. If global asset managers see the SPX as a value market and reallocate assets into SPX, then it should bode well for SPX in 2006. However if the SPX:MSCI world ratio breaks down, it's another indication of the multi-year, secular movement away from SPX stocks.

Most worrying chart: SPX-GLD


In a strong stock market, gold should be an underformer, as money shifts into paper assets. The outperformance of gold in Q4, 2005 is troubling.

Gold at resistance: break-out or down?


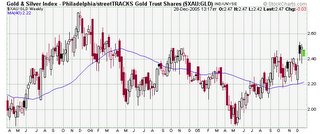
Is the XAU strength a quarterly fluke or the beginning of a multi-year trend? XAU is right at resistance v. GLD. As XAU stocks have gone parabolic be wary to a reversal in January. If XAU merely consolidates, buy the dips as XAU is in a multi-quarter uptrend.

Tuesday, December 27, 2005

Tuesday, December 26, 2005

RS weakening: energy (OSX, XNG, alt. energy, coal). Sell into strength, reopen positions if RS emerges 1/06.

RS gaining: XLB, XLV.

Market Strength 10-day high: ~2530
Market Strength 10-day low: ~2406 (12/27 monday)
Market Strength intraday stochastic: 0, trend falling

Nasdaq 10-day high: ~2270
Nasdaq 10-day low: ~2215
Nasdaq 10-day stochastic: 22.5, falling

Breakout Strength, 10-day stochastic: 75, rising

Outlook: Watch for weekly breakdown. Volatile moves, SPX:TLT ratio showing signs of confirmed downtrend. Sell into stength, tighten stops. Wary of false breakouts. Energy breaking down.

Find potential long and/or short plays for the first week of January.

Finding a floor


Last week, it looked like a possible bottom was set. Tuesday's intraday reversal threatens to start 2006 ominously. While today's close barely broken down past last week's close, the SPX:TLT ratio sliced below its recent range. This suggests that money is flowing out of SPX and into tlt, a defensive play indicating a bet on recession...especially as the yield curve is getting inverted.

Monday, December 26, 2005

interesting ideas for 2006

index: btk

adlr

12-23
for ideal: HOLX, BOOM NETL RTI LCAV IPS

ont nmgc spex mspd avii bvf mygn anx mnta lifc orct crxl cers cmd akn ptn isv rvsn cece tsem cmd ptn akn isv rvsn cece

spx: medi gild

watch omni: ont spex mspd avii bvf mygn orct cmd vnx

save these dates: wargaming 2006

[DRAFT POST]

significant times and possible scenarios.

January: Portfolio reallocation by institutions/individuals. Institutions are placing their bets for 2006 and will establish/increase favored sectors, so follow the elephant tracks and avoid stepping in the dung. Buy January breakouts, sell January breakdowns.

late March-April: Tax time. Breakouts and breakouts tend to fail more often. Merely an supposition, tough to find data to corroborate.

Sectors looking good: btk, hui, sox, xbd

Speculative plays watch list: ont nmgc spex mspd avii bvf mygn anx

Mid-Sept to Oct: Watch for mark-ups in leaders ahead of October/fiscal year end.


Google